Why Minimum FPS Can Be Misleading
Check Out These Frame Rates
Here's where things get interesting. If we take the built-in benchmarks we're running for our GPU tests and log frame rates with FRAPS, this allows us to calculate the average FPS as well as the average FPS of the slowest three percent of frames—what we're calling the "average 97 percentile." We can also look at the true instantaneous minimum FPS according to FRAPS. You might assume all of the games report the absolute minimum FPS, but it turns out they all vary in how they're calculating minimums.
Some of the tests appear to "miss" counting certain frames while others seem to have some sort of percentile calculation in effect. The short summary is that most of the games show unwanted variations in this metric. But let's not jump ahead. In the charts below, we'll look at the reported "minimums" compared to our calculated "average 97 percentile" to show what's going on. We'll also provide separate commentary on each chart to discuss what we've noticed during testing.
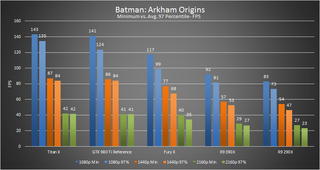
Starting with Batman: Arkham Origins, we immediately see that the "minimum" FPS reported by the built-in benchmark already appears to be doing some form of percentile calculation. Our "average 97 percentile" in all cases is lower than the game's reported minimum, and it would appear Arkham Origins is using a 90 percentile or similar; we've also noticed a tendency for the built-in benchmark to report a lower than expected "minimum" that only occurs between scenes. Looking at AMD and Nvidia GPUs, we have two different results. On the Nvidia side, our 97 percentile and the game's reported minimums are relatively close at higher resolutions, while on AMD hardware we see a relatively large discrepancy. This is one of several titles where the built-in benchmark provides somewhat "misleading" (or at least, not entirely correct) minimum frame rate reporting.
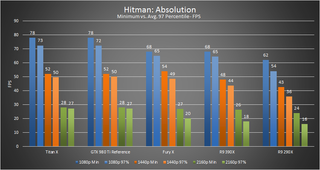
Hitman: Absolution shows some of the same issues as Arkham Origins. The supposed minimum frame rates the built-in benchmark reports are either skipping some frames or using a percentile calculation. Interestingly, this appears to benefit AMD GPUs in particular at higher resolutions, where 4K on the 390X has a reported minimum that's 44 percent higher than our average 97 percentile calculation.
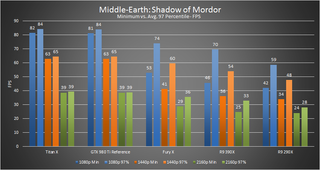
Shadow of Mordor reverses the trend and we see universally higher frame rates compared to the reported minimum FPS. This time, however, AMD cards were being hurt by lower reported minimums. The reason is actually pretty straightforward: For the first few seconds after the benchmark begins, AMD GPUs in particular have a frame every half a second or so that takes longer to render. Once all the assets are loaded, things smooth out, but those early dips occur more frequently on Radeons. Also note that we were running this particular benchmark three times in succession at each resolution to try to stabilize the reported minimum FPS—if we only ran the test once, the reported minimums would be substantially lower on all GPUs.
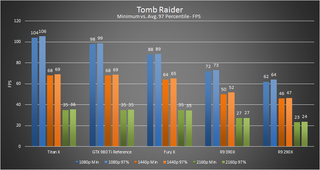
Finally, we have a game where the reported minimum FPS closely matches our average 97 percentile calculations. It could be that Tomb Raider was already doing a percentile calculation, or more likely it's due to the fact that the benchmark scene isn't very dynamic, so the typical minimum FPS occurs for a longer period of time. The game also appears to pre-cache all assets, as much as possible, so there aren't any unusual spikes in FPS. The net result is that at most resolutions, we only see a 1–2fps difference, so the built-in gives meaningful and consistent results—at least for this particular game.
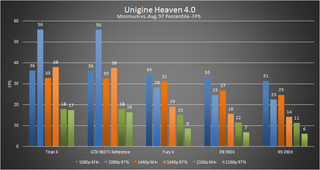
Of the five games/engines we're testing for this article, Unigine Heaven has the least reliable/useful minimum FPS reporting. At lower resolutions on Nvidia hardware, a few dips in frame rate during scene transitions skew the numbers, so our 97 percentile results are substantially higher. Where things get interesting is on AMD GPUs, where the engine actually appears to miss some of the low frame rates. This might be something a driver update could address, but a detailed graph comparing the 980 Ti and Fury X will help illustrate the current problem better:
The biggest gaming news, reviews and hardware deals
Keep up to date with the most important stories and the best deals, as picked by the PC Gamer team.
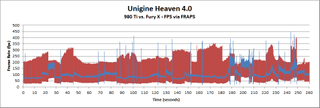
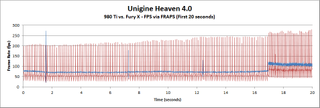
We used two graphs because Heaven is a longer benchmark, and looking at the full 260-second chart doesn't clearly show what's happening. Zooming in on the first 20 seconds gives the proper view. Basically, while there are minor fluctuations in FPS on the GTX 980 Ti, on the Fury X (and other AMD GPUs show the same issue), there's a pattern that repeats every seven frames: one slow-to-render frame, one fast-to-render frame (most likely a runt frame), and then five frames at a mostly consistent rate. Right now, this is occurring throughout the 260-second test sequence. The result is a stuttering frame rate that's noticeable to the user, though thankfully Unigine is more of a tech demo/benchmark as opposed to an actual game.
Putting It All Together
"Hey, you in the back... WAKE UP!" Okay, sorry for the boring math diatribe, but sometimes it's important to understand what's going on and what it really means. This isn't intended as any form of manifesto on frame rates, and in fact this is a topic that has come up before. Nvidia even helped create some hardware and software to better report on what is happening on the end-user screen, called FCAT (Frame Capture Analysis Tool), but frankly it can be a pain to use. Our reason for talking about this is merely to shed some light, once more, on the importance of consistent frame rates.
We've been collecting data for a little while now, and since we were already running FRAPS for certain tests it makes sense to look at other places where it makes sense. We're planning to start using our 97 percentile "average minimum FPS" results for future GPU reviews, as it will help to eliminate some discrepancies in the reported frame rates from certain games (see above). It shouldn't radically alter our conclusions, but if there are driver issues (e.g., AMD clearly has something going wrong with Unigine Heaven 4.0 right now), looking at the reported minimum FPS along with the 97 percentile will raise a red flag.
If you read one of our GPU reviews in the near future and wonder why some of the minimum FPS results changed, this is why. It will also explain why some of our results won't fully line up with other results you might see reported—we're not willing to trust the reported minimums.
And if you really want to know how to calculate a similar number... fire up Excel, open your FRAPS frametimes CSV, and calculate the individual frame times in column C (e.g., C3 = B3 - B2). Copy that formula down column C until the end of the collected data. Then the "average 97 percentile" is as follows, where "[C Data]" is the range of cells in column C containing individual frame times (e.g., "C3:C9289"):
=COUNTIF([C Data], ">"& PERCENTILE.INC([C Data],0.97))/SUMIF([C Data], ">"&PERCENTILE.INC([C Data],0.97))*1000
Follow Jarred on Twitter.
Jarred's love of computers dates back to the dark ages when his dad brought home a DOS 2.3 PC and he left his C-64 behind. He eventually built his first custom PC in 1990 with a 286 12MHz, only to discover it was already woefully outdated when Wing Commander was released a few months later. He holds a BS in Computer Science from Brigham Young University and has been working as a tech journalist since 2004, writing for AnandTech, Maximum PC, and PC Gamer. From the first S3 Virge '3D decelerators' to today's GPUs, Jarred keeps up with all the latest graphics trends and is the one to ask about game performance.
Most Popular


